Inflation Hit a Three-Year High. Read the Fine Print Before You Panic.


Inflation just hit a three-year high of 4.2%, and the headlines are screaming. But dig into the report and the story changes: more than 60% of that spike is energy, driven by the Iran conflict, which means it can reverse as fast as it arrived. Meanwhile the housing crash the doomers promised again never showed. Existing sales rose, prices rose, first-time buyers grew. Here is the real read for East Valley buyers and sellers.
There are two ways to read a scary economic headline. You can take the top-line number and panic, or you can open the report and find out what is actually driving it. This week handed us a perfect example. Consumer inflation jumped to 4.2% over the past year, the highest in three years, more than double the Fed's 2% target. That is the headline. The reality underneath it is far more nuanced, and for East Valley buyers and sellers, far more useful.
The Inflation Spike Is Mostly One Thing: Energy
Here is the detail the headlines skip. The energy index rose 3.9% in May, and energy alone accounted for more than 60% of the entire monthly inflation increase. This is not broad-based, everything-is-getting-expensive inflation like we saw in 2021. This is a concentrated energy shock tied directly to the Iran conflict and oil prices.
Why does this matter so much? Because energy does not just show up in the energy line. It ripples through everything. Food gets more expensive because food is transported by truck, and trucks run on fuel. The same is true across much of the economy. So when energy moves, it drags a lot of other categories with it, which is exactly what inflated this report.
Strip out food and energy entirely, and core inflation comes in at 2.9% over the year. Still above the 2% target, but a very different picture than the 4.2% headline. And consider the trend just months ago: as recently as February, before this energy shock, inflation was tracking down toward 2.4% and falling. The spike is recent, and it is concentrated.
The honest takeaway: this inflation reading is real and it is high, but its concentration in energy makes it potentially temporary in a way the 2021 inflation never was. That distinction matters enormously for where rates go next.
What It Means for Rates and the East Valley
With inflation flashing high, the betting markets now price in essentially no chance of a Fed rate cut at next week's meeting, and they see roughly even odds of a hike versus a cut later this year. The projections lean toward get used to these rates for now. The 30-year fixed has been living in the high 6.6s, near its year-to-date high.
But here is the connection the headlines miss: if this inflation is mostly energy, and energy stabilizes, the rate outlook can shift quickly in the other direction. That is precisely why the smartest move for an East Valley buyer is not to time the perfect rate, but to be ready to act when the window opens. Buyers who are pre-approved and prepared capture opportunity the moment conditions improve. Buyers waiting for certainty get the news last.
The Housing Crash That Never Comes
Every year, the online doomers predict a 50% home price crash. Every year, it does not happen. This month's data buried that prediction again, and it is worth looking at the actual numbers, because they tell East Valley sellers and buyers what is really going on.
Nationally, inventory sits around 4.5 months of supply, which is close to a neutral, balanced market, as even as the market has been in five to seven years. But that national average hides important regional differences, and this is where the East Valley story sharpens.
The Regional Split That Favors East Valley Buyers
The national 4.5-month supply masks a real divide. The Northeast is a strong seller's market struggling with low inventory. The Sun Belt, including Arizona, leans more toward a buyer's market with more supply and more negotiating room. The South continues to lead the country in inbound migration, making up roughly half of all sales nationally.
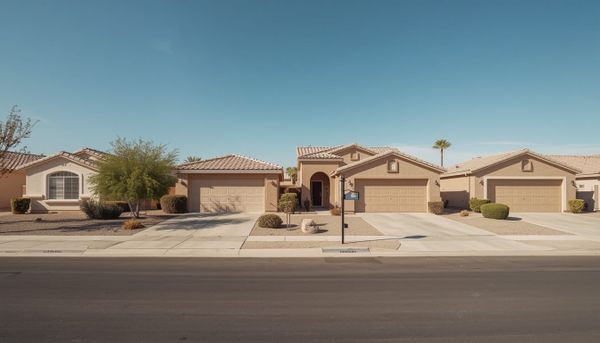
For the East Valley, that combination is favorable. Arizona sits in the Sun Belt buyer-leaning category, which means more choices and more leverage for prepared buyers in Mesa, Gilbert, Chandler, Queen Creek, San Tan Valley, and Apache Junction. And the migration engine that has fueled East Valley growth for years remains intact, supporting long-term demand even as the pace has normalized.
One more national detail worth noting for context: the majority of home sales nationwide are still happening under $500,000, with the strongest activity in the $100,000 to $250,000 range. The East Valley offers genuine options across price points, from the accessible entry of Apache Junction and San Tan Valley to the premium of Gilbert and Chandler, which is exactly the kind of range that keeps a market healthy and reachable.
The Bottom Line for East Valley Buyers and Sellers
Strip away the noise and here is what this week's data says. Inflation is high but concentrated in energy, which makes it potentially temporary and the rate outlook genuinely two-sided. The housing crash predictions failed again, with sales, prices, and first-time buyer share all rising. And the Sun Belt's buyer-leaning conditions give prepared East Valley buyers real opportunity right now.
The buyers and sellers who win in a market like this are not the ones who react to headlines. They are the ones who understand the data underneath and position themselves to move. That is the conversation worth having before the next headline lands.
Not necessarily, and here is why. More than 60% of the recent inflation spike is energy, tied to the Iran conflict, which makes it potentially temporary rather than the broad-based inflation of 2021. If energy stabilizes, the rate picture can improve quickly. Buyers who are pre-approved and ready capture that improvement the moment it arrives. Waiting for the headlines to feel calm usually means acting after the opportunity has already passed.
The current data points strongly against it. The national median existing-home price rose 1.3% year over year, existing sales are up, and distressed sales are down. Historically, nominal home price drops have only happened during severe financial crises, not in normal markets. Real estate moves slowly. The repeated 50% crash predictions have failed every year, and this month's numbers are another example of recovery rather than collapse.
Nationally the market is close to neutral at about 4.5 months of supply, but it varies by region. The Sun Belt, including Arizona, leans more toward a buyer's market with more inventory and negotiating room, while the Northeast remains a tight seller's market. For the East Valley, that means prepared buyers currently have more leverage and choice. Conditions still vary by community and price point, so local guidance matters.
The betting markets currently see almost no chance of a cut at next week's meeting and roughly even odds of a hike versus a cut later in the year, largely because of the energy-driven inflation spike. The honest answer is that the outlook is genuinely two-sided and depends heavily on whether energy prices stabilize. Rather than trying to predict the exact move, the practical strategy is to be ready to act whichever way it breaks.
Give them the data underneath the headline. Inflation is high but mostly energy, which makes it potentially temporary. Home sales and prices are rising, not crashing. First-time buyers grew to 35% of the market. The Sun Belt favors buyers right now. Clients who understand this position themselves to act while nervous competitors sit on the sidelines. Pairing that perspective with a lender who can get them truly ready turns anxiety into a plan.
If inflation is mostly energy, the rate picture can turn fast. A full pre-approval puts you in position to act the moment conditions improve, instead of finding out last.
GET PRE-APPROVEDHelp your buyers and sellers see past the panic headlines. Partner with a lender who reads the data clearly and gets your clients ready to move across the East Valley.
PARTNER WITH JOHNCrossCountry Mortgage, LLC. Equal Housing Lender. NMLS #3029. This is not a commitment to lend. All loans subject to credit and property approval. Economic and housing data referenced from CPI/PPI releases, NAR existing home sales, and Mortgage Bankers Association figures as of June 2026; market conditions and rates change frequently. Not financial or investment advice.